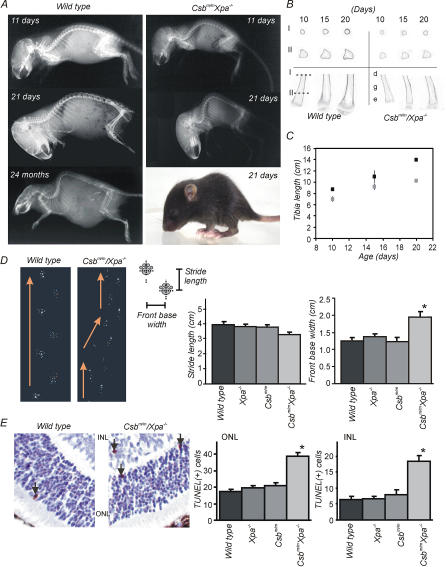
Figure 2. Skeletal and Neurological Abnormalities in Csbm/m/Xpa−/− Mice.
(A) Radiographs of wt and Csbm/m/Xpa−/− mice (age as indicated) and photograph of a 15-d-old Csbm/m/Xpa−/− mouse (C57BL/6J).
(B) 2-D images of micro-CT scans of tibiae taken from Csbm/m/Xpa−/− animals and wt littermate controls (age indicated in the figure). Horizontal sections are shown of the upper and lower part of the tibiae. e, epiphysis; g, growth plate; and d, diaphysis. I indicates the section through the smaller part of the diaphysis, II indicates section through the broader part of the diaphysis.
(C) Growth of tibiae, taken from Csbm/m/Xpa−/− animals (light squares) and wt littermate controls (dark squares).
(D) Representative footprint patterns of 19-d-old wt and Csbm/m/Xpa−/− mice. Arrows indicate the trajectory of each mouse. Stride length and front base width measurements on 15-d-old wt, Xpa−/−, Csbm/m, and Csbm/m/Xpa−/− mice. The significantly (asterisk; p < 0.001) greater base width in the double mutant mouse indicates ataxia.
(E) Representative pictures of a TUNEL staining in the retina of wt and Csbm/m/Xpa−/− mice and quantification of the number of TUNEL positive cells. Arrows indicate TUNEL positive cells in the ONL and INL. Note the significantly higher number of TUNEL-positive cells in both the ONL and the INL in the retina of Csbm/m/Xpa−/− compared to wt mice (asterisk; p < 0.05).

