FIG. 1.
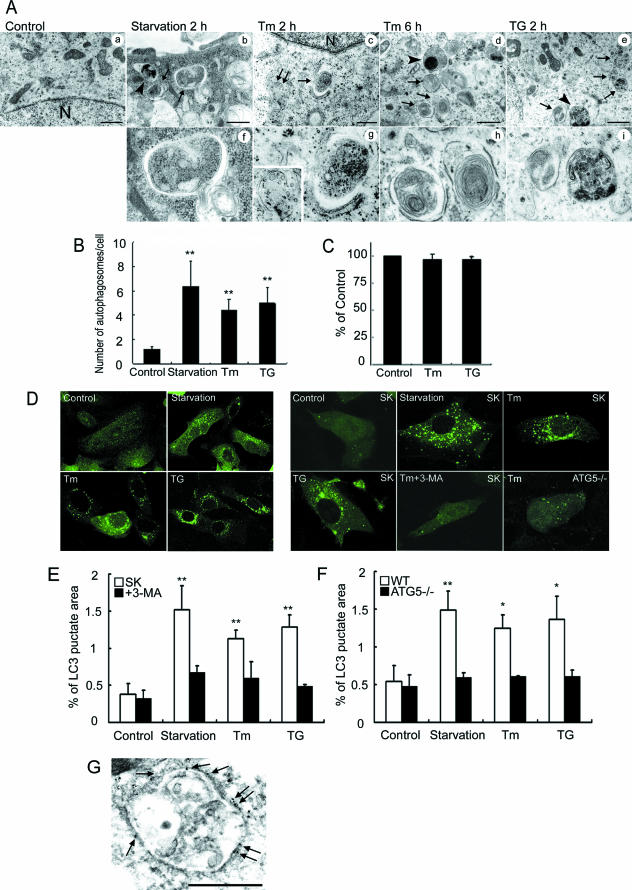
Autophagosome formation is activated by ER stress. (A) Electron microscopic analysis of SK-N-SH cells exposed to 2 μg/ml Tm, 1 μM TG, or amino acid deprivation for the indicated times. Panels f to i are high magnification images of panels b to e, respectively. Typical autophagosomes (arrows), autolysosomes (arrowheads), and multivesicular bodies (indicated by double arrows in c and shown in the inset in g) are indicated. Scale bars, 1 μm. (B) The numbers of autophagosomes in SK-N-SH cells after exposure to the indicated stimuli for 2 h. A total of 30 electron microscopical sections were prepared, and autophagosomes were defined as double- or multiple-membrane structures in the cytosol. The values are the means ± standard deviations of three independent experiments. Asterisks indicate a significant difference from control cells (**, P < 0.01) (Student's t test). (C) Nutrient uptake after ER stress. MEF cells were treated with 2 μg/ml Tm or 1 μM TG for 2 h and then subjected to amino acid uptake assay as described in Materials and Methods. Results were expressed as the percentages of the counts compared with those in the absence of Tm or TG. The values are the means ± standard deviations of three independent experiments. (D) Autophagosome formation in SK-N-SH cells or ATG5-deficient (ATG5−/−) MEFs treated with ER stressors (left panels, whole fields; right panels, high magnification images). Cells were transfected with an expression vector for GFP-LC3 and then stimulated by each stressor for 2 h. The formation of GFP-LC3-labeled punctate structures is observed in cells exposed to Tm, TG, and amino acid starvation. Note that the GFP-LC3 dot formation is inhibited by treatment with 10 mM 3-MA and in ATG5−/− cells. (E and F) Quantification of the GFP-LC3-labeled punctate areas in the SK-N-SH cells (E) and MEFs (F) shown in panel D. The ratios of the total GFP-LC3 dot areas to the overall cellular areas are shown as percentages. The values are the means ± standard deviations of three independent experiments. Asterisks indicate a significant difference from control cells (**, P < 0.01; *, P < 0.05) (Student's t test). WT, wild type. (G) Immunoelectron microscopic analysis of SK-N-SH cells transiently transfected with an expression vector for GFP-LC3. Cells were exposed to 2 μg/ml Tm for 6 h. Immunogold particles of GFP-LC3 (arrows) are present on the membranes of autophagosomes. Scale bar, 1 μm.

