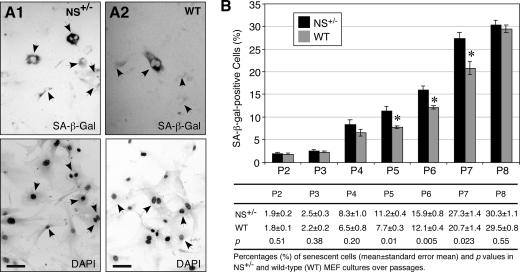
FIG. 3.
NS haploinsufficiency led to increased numbers of senescent cells in the P5 to P7 MEF cultures. Representative views of the senescent cells, detected by the SA-β-Gal assay in the top panels, and the total numbers of cells, determined by DAPI nuclear staining in the bottom panels, were shown for the P7 NS+/− (A1) and wild-type (WT, A2) MEF cultures. Arrows indicate SA-β-Gal+ cells. Bars, 100 μm. (B) The percentages of SA-β-Gal+ cells were increased in the NS+/− MEF culture (black bars) compared to the WT culture (gray bars) from P5 to P7 (top panel). Error bars represent standard errors of the means. Means (± standard errors of the means) and P values are provided in the bottom panel.

