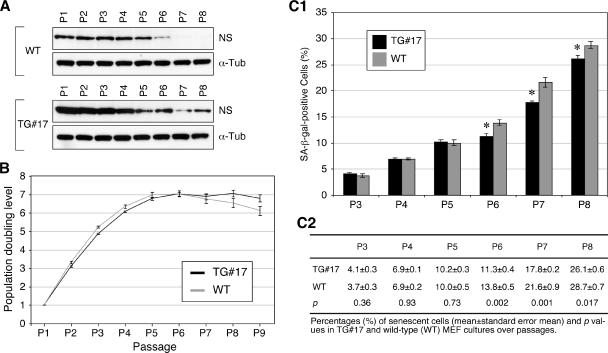
FIG. 7.
MEFs overexpressing NS at a high level had a longer life span and fewer senescent cells than did the WT MEFs. (A) Protein expression levels of NS in the WT and TG#17 MEFs from P1 to P8. Anti-α-tubulin immunoblots were used as loading controls (α-Tub). (B) PDLs of the TG#17 and WT MEF cultures over 9 passages are shown in black and gray, respectively. (C) Percentages of SA-β-Gal+ cells were decreased in the TG#17 MEF cultures (black bars) compared to the WT cultures (gray bars) from P6 to P8. Error bars represent standard errors of the means in panels B and C1. Means (± standard errors of the means) and P values are shown in panel C2.

