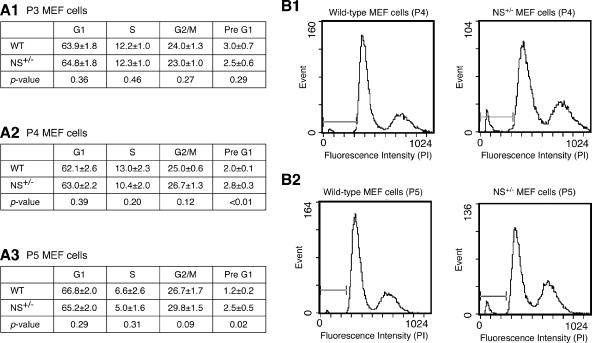
FIG. 8.
The pre-G1 percentage was elevated in the P4 and P5 NS+/− MEF cultures compared to the WT cultures of the same passages. (A) MEF cultures derived from 8 NS+/− and 8 WT embryos of 3 different litters were examined for their cell cycle profiles at P3, P4, and P5. Every culture was analyzed in duplicate. The average percentages of the G1, S, G2/M, and pre-G1 phase cells were summarized as means ± standard errors of the means in panel A1 for P3 cultures, panel A2 for P4 cultures, and panel A3 for P5 cultures. Statistical analyses showed that the pre-G1 cell percentages were higher in the NS+/− cultures than in the WT cultures at P4 and P5. Representative cell cycle profiles of the P4 (B1) and P5 (B2) NS+/− and WT MEF cultures are shown. x axes represent the propidium iodide (PI) intensities; y axes represent the event frequencies.

