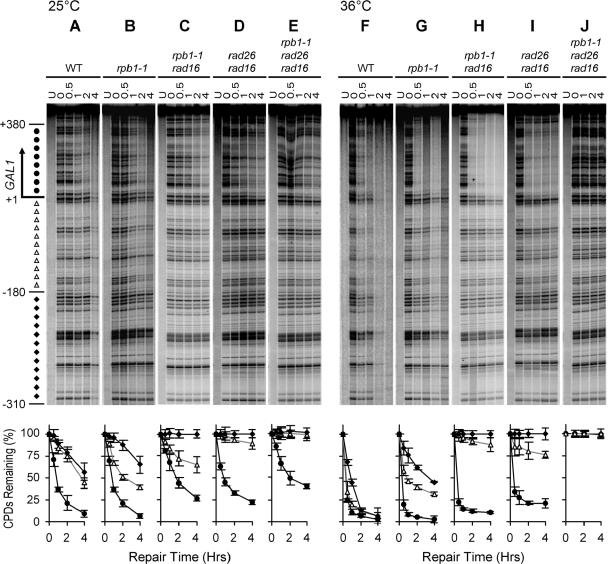
FIG. 5.
NER in the TS of the GAL1 gene in cells cultured at 25°C and 36°C. Gels show repair in different strains. Lanes labeled U are unirradiated samples. Other lanes are samples of different times (hours) of repair incubation. An arrow to the left of the gels marks the transcription start site. Solid circles to the left of the gels mark transcribed region (+1 to +380). Open triangles and solid diamonds mark upstream regions where TCR is operative (−1 to −180) or inoperative (−181 to −310), respectively. Plots underneath each of the gels show the average (mean ± standard deviation) of the percent CPDs remaining at individual sites in the transcribed (+1 to +380) region (solid circles) and upstream regions where TCR is operative (−1 to −180) (open triangles) and inoperative (−181 to −310) at different times of repair incubation. WT, wild type.

