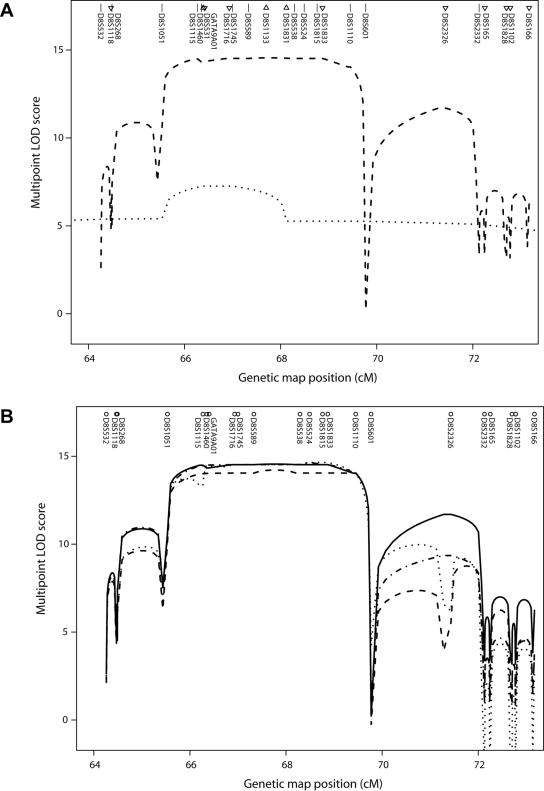
Figure 2. .
Multipoint linkage analysis of MPS IIIC on chromosome 8. A, Multipoint LOD scores in an 8.9-cM interval from two sets of families. Symbols above the marker names indicate the map position. Marker names are listed in the correct order but may be displaced from the symbols for visibility. The dashed line is based on families genotyped in Montreal, and the dotted line on families genotyped in Prague. Straight lines next to marker names indicate that the markers were typed in both data sets. Triangles pointing down indicate markers typed only in the Montreal data set, and triangles pointing up indicate markers typed only in the Prague data set. For the Montreal data, the SimWalk2 run with the highest likelihood is shown. TMEM76 lies between D8S1115 and D8S1460, and, according to the March 2006 freeze of the human genome sequence from the University of California–Santa Cruz Genome Browser,30 the order is D8S1115–(500 kb)–TMEM76–(800 kb)–centromere–(200 kb)–D8S1460. B, Multipoint LOD scores from the Montreal data from four runs of SimWalk2, version 2.91,19 showing the variation between runs.

