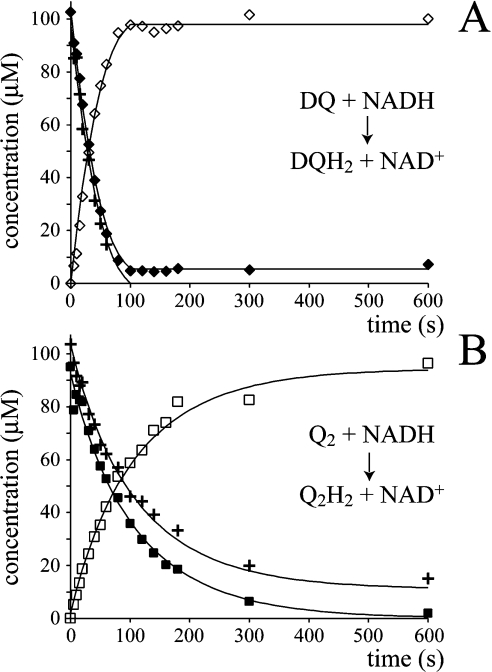
Figure 3. The reduction of DQ and Q2 by NADH, catalysed by complex I.
The reaction was initiated by the addition of approx. 100 μM DQ or Q2 to the assay buffer containing NADH, complex I and asolectin phospholipids, and monitored by HPLC analysis (◆, DQ; ■, Q2; ◇, DQH2; □, Q2H2) and UV–visible spectroscopy (+,NADH). (A) Conversion of DQ into DQH2 modelled using Km=24 μM, Ki=26 μM and kcat=3.0 mol−1·dm3·s−1. (B) Conversion of Q2 into Q2H2 modelled using Km=20.4 μM, Ki=15.7 μM and kcat=1.2 mol−1·dm3·s−1.

