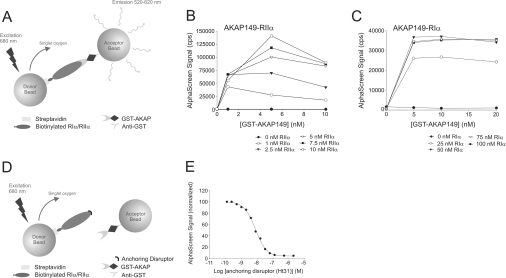
Figure 1. Principle of the PKA–AKAP anchoring competition/disruption assay using AlphaScreen technology.
(A) Streptavidin-coated donor beads and anti-GST-coated acceptor beads are brought into close proximity when the biotinylated R–GST–AKAP complex conjugates to the respective beads. Upon laser light excitation, singlet oxygen is produced by the photosensitizer in the donor bead and can diffuse to the acceptor bead, giving rise to a chemiluminescent/fluorescent signal, i.e. the AlphaScreen signal. The concentration-dependent interactions of RIIα–AKAP149 (B) and RIα–AKAP149 (C) assessed by AlphaScreen are shown. The different graphs show an increase in signal with increasing concentrations of biotinylated R subunit dimer. cps, counts per second. (D) A specific anchoring disruptor, competing with AKAP for binding to the R subunit dimer is capable of displacing the binding between the R subunit and the AKAP. Thus the acceptor and donor beads are no longer in close proximity and the AlphaScreen signal decreases. (E) A representative concentration-dependent inhibition curve of an anchoring disruptor (Ht31) that competes with AKAP149 for binding to RIIα with an IC50 of 7.6 nM (average IC50 for all experiments was 6±1 nM). The interaction partners were used at a 1 nM concentration in the assay.

