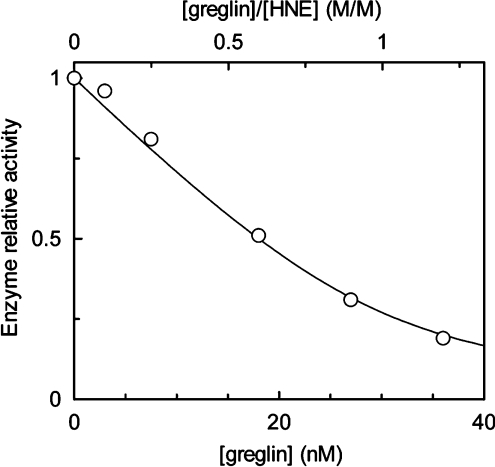
Figure 6. Inhibition of sputum elastase activity by greglin.
Aliquots of homogenized sputum containing a constant concentration of HNE were reacted with increasing quantities of greglin. The final enzyme concentration (30 nM) was estimated as described in the text and Abz-APEEIMRRQ-EDDnp was used as the substrate. Under the experimental conditions used, the decrease in HNE activity versus the inhibitor concentration is concave, therefore the data could be analysed as described in the legend of Figure 4 to obtain Ki(app). The curve was generated using eqn (3) and Ki(app)=3.28 nM.

