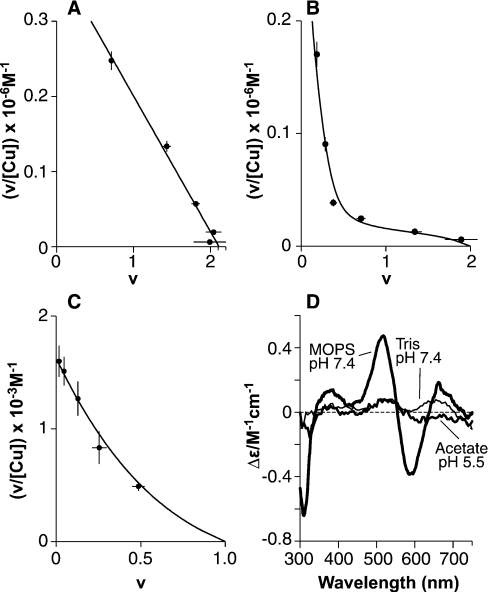
Figure 7. Equilibrium dialysis reveals two distinct forms of copper (II) co-ordination in PrP91–115.
Scatchard plots of equilibrium dialysis data for PrP91–115 show copper (II) binding with stoichiometries of 0.5:1 or 2:1, depending on the solution conditions. (A) In 50 mM Mops buffer at pH 7.4, with copper presented as a glycine complex, two sites (intercept=2.11) of equal affinity are observed, each with an apparent dissociation constant of 5.5±0.5 μM. (B and C)The formation of a 0.5:1 complex gives a non-linear Scatchard plot. The data were fitted numerically as described in the text, the results of which are represented as continuous lines. Dialysis against CuSO4 in 5 mM Tris, pH 7.4 (B), showed formation of a Cu(PrP91–115)2 complex at low copper concentrations and a Cu2PrP91–115 complex at higher copper concentrations. In 10 mM acetate, pH 5.5, only the Cu(PrP91–115)2 complex was observed (C). (D) CD spectra could be observed for both the Cu(PrP91–115)2 and the Cu2(PrP91–115) complex. The spectra of the Cu(PrP91–115)2 complex formed in 5 mM Tris buffer, pH 7.4 (100 μM PrP91–115, 60 μM CuSO4, i.e. 0.5:1 CuSO4 and 10 μM free CuSO4) and the Cu(PrP91–115)2 complex formed in 10 mM acetate, pH 5.5, are indicated (100 μM PrP91–115, 1 mM CuSO4). The spectrum of the Cu2PrP91–115 complex formed at pH 7.4 in 50 mM Mops is also shown (60 μM PrP91–115, 200 μM copper bisglycinate).

