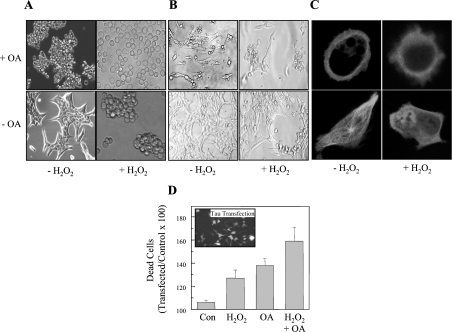
Figure 7. Toxicity of tau aggregates.
A day after transfection with tau–CFP, HT22 cells were used as controls, or were exposed to 1.0 mM H2O2 alone for 30 min, or to 0.5 μM OA alone for 3 h, or to the combination of 1.0 mM H2O2 plus 0.5 μM OA, as described in the legend to Figure 6. (A) Light microscopy images are shown of control and treated cells. (B) The distribution of tau–CFP directly after each of the treatment procedures, as detected by CLSM. To measure the effect of tau phosphorylation and oxidation on cell viability, HT22 cells were transfected with tau–GFP (C) The effect of H2O2 and OA on the viability of both transfected (fluorescent) cells, and non-transfected cells was measured. To estimate the role of tau in the cell survival, we calculated the ratio between the viability of transfected cells and the viability of non-transfected cells (×100), and these results (means±S.E.M., n=3) are reported in (D) as percentage of dead cells.

