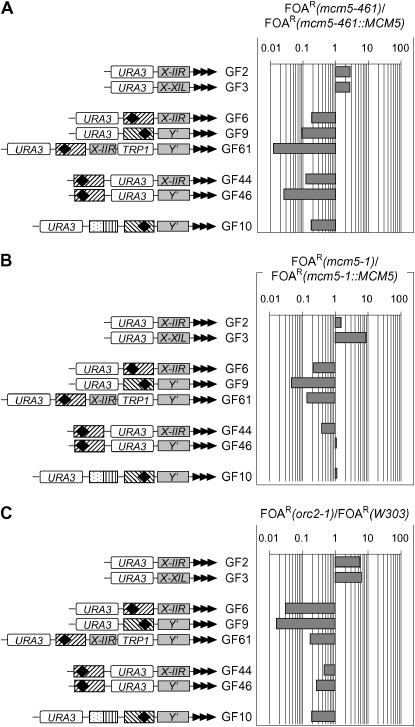
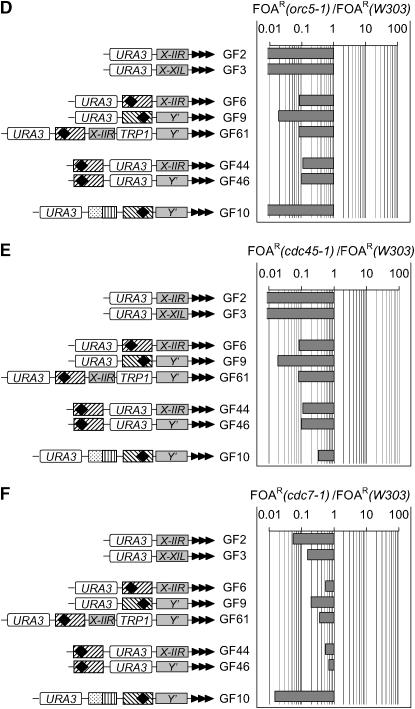
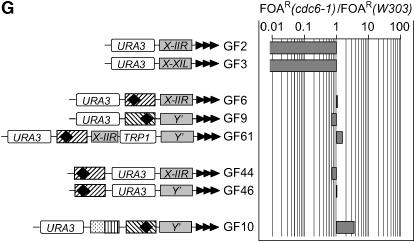
Figure 3.—
Differential silencing of URA3 in mutant strains. The GF constructs in Figure 1 were inserted in the VII-L telomere of mcm5-461, mcm5-461∷MCM5, mcm5-1, mcm5-1∷MCM5, W303, orc2-1, orc5-1, cdc45-1, cdc7-1, and cdc6-1 strains and %FOAR was determined for each construct/strain combination. The graphs show the ratio of %FOAR in the mutant vs. %FOAR in the isogenic wild-type strain. Data are from supplemental Table 1 at http://www.genetics.org/supplemental/. The diagrams from Figure 1 are shown on the left. Values above one indicate increased repression of URA3 in this construct in the mutant relative to the isogenic wild-type strain. Values below one indicate derepression. The following ratios are shown: (A) %FOAR mcm5-461 vs. %FOAR mcm5-461∷MCM5; (B) %FOAR mcm5-1 vs. %FOAR mcm5-1∷MCM5; (C) %FOAR orc2-1 vs. %FOAR W303; (D) %FOAR orc5-1 vs. %FOAR W303; (E) %FOAR cdc45-1 vs. %FOAR W303; (F) %FOAR cdc7-1 vs. %FOAR W303; (G) %FOAR cdc6-1 vs. %FOAR W303.


