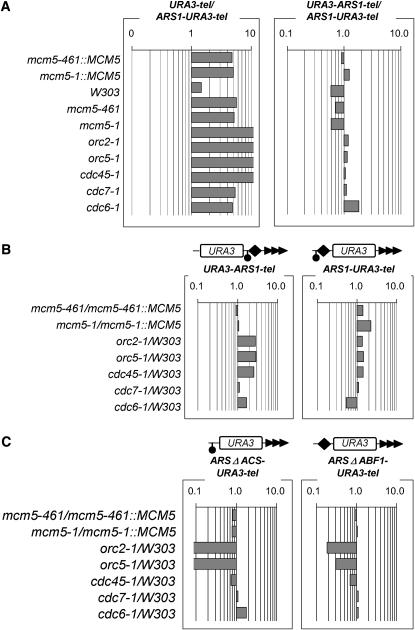
Figure 5.—
Isolated nontelomeric ACS does not recapitulate the effects of mutations in the GF constructs. (A) The ratio of %FOAR in URA-tel vs. ARS1-URA3-tel and in URA3-ARS1-tel vs. ARS1-URA3-tel in the strains shown on the left was calculated and plotted. Data are from supplemental Table 3 at http://www.genetics.org/supplemental/. (B and C) The ratio of %FOAR in mutant vs. %FOAR in wild-type strains as indicated on the left was calculated and plotted from the numbers in supplemental Table 3. Each series of bars represents the calculations for the constructs shown at the top.

