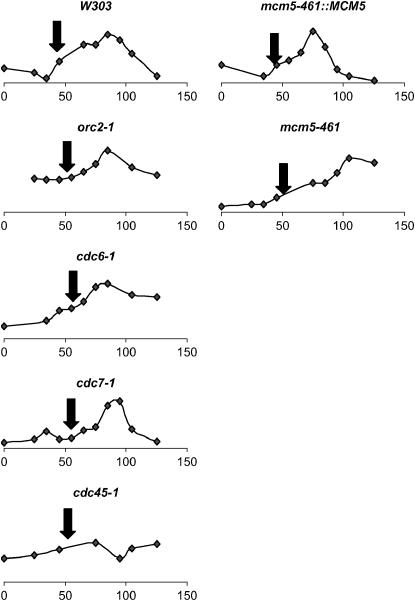
Figure 6.—
Replication timing of telomeric DNA in different mutants. Each graph represents the relative abundance of DpnI-resistant telomeric DNA in nocodazole synchronized cells that express DamI methylase. The name of each strain is shown at the top of each graph. Time (minutes) after release of mitotic block is shown at the bottom. The arrow indicates the peak of abundance of DpnI-resistant ARS305 DNA. Details are provided in materials and methods.

