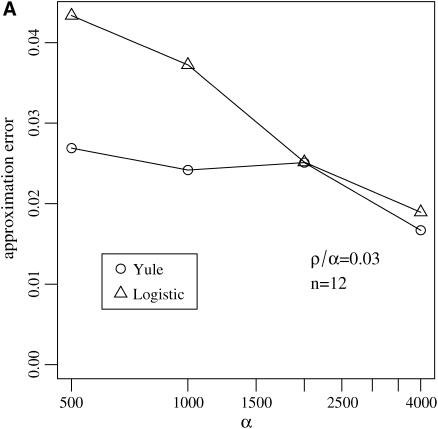
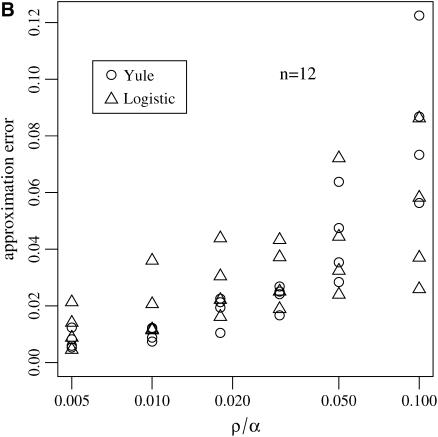
Figure 6.—
Approximation errors  and
and  for the sizes of the two biggest families that are identical by descent during the sweep for the Yule and the logistic models. Every point is based on 105 simulations of a sample of size 12 in the Wright–Fisher model with population size 105 and the corresponding approximating Yule and logistic models. (A) The ratio of recombination rate and selection strength ρ/α = 0.03 is fixed and α varies. (B) Several ratios ρ/α were considered. For each of these ratios, α = 500, 1000, 2000, and 4000 are considered. The values for ρ/α = 0.03 are based on the simulations shown in A.


