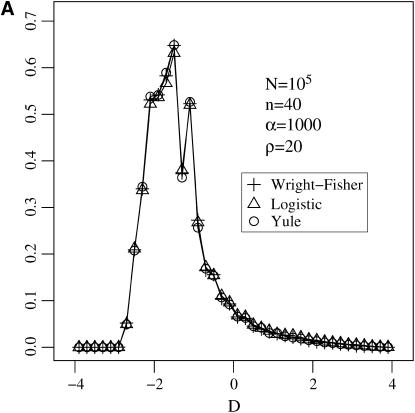
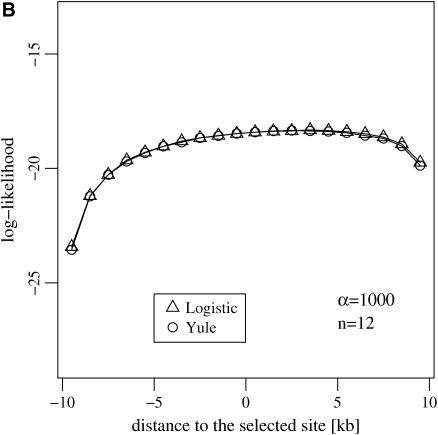
Figure 8.—
(A) The distribution of Tajima's D estimated at the end of a selective sweep by simulating the Wright–Fisher model and the logistic and the Yule approximations during the selective phase. (B) The log-likelihood curve for the position of a selected locus given data from two adjacent neutral loci. The position of the selected site is at 0.


