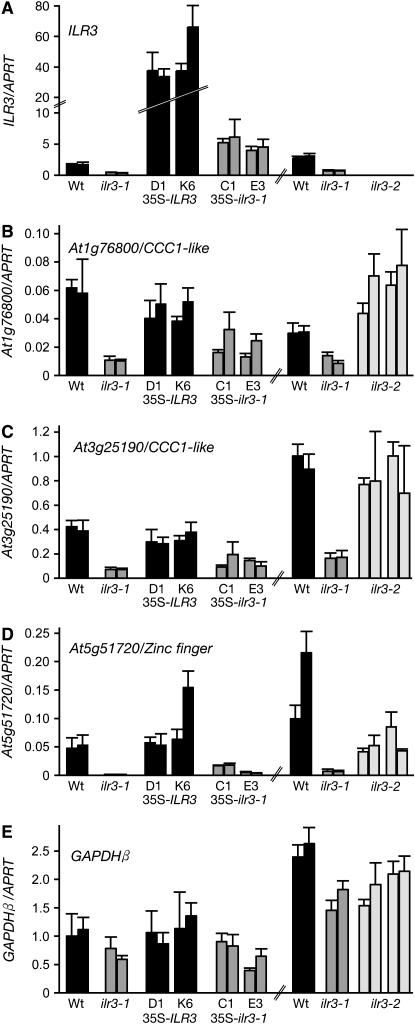
Figure 6.—
Specific transcripts misregulated in ilr3 mutants. ILR3 (A) and the indicated putative ILR3 target mRNAs (B–D) were quantified in total RNA prepared from 7-day-old seedlings from Col-0 (Wt), ilr3-1, two independent lines each for Wt (35S–ILR3) and Wt (35S–ilr3-1), and progeny of two ilr3-2 plants using quantitative real-time RT–PCR with gene-specific oligonucleotides and probes. GAPDHβ is a nontarget control message (E). mRNA levels are displayed relative to the level of an APRT control mRNA (Woodward and Bartel 2005a) in the sample, and bars represent mean values for three PCR replicates for two independent reverse transcription reactions on biological replicates. Error bars show the standard deviations of the means for three PCR replicates of a single reverse transcription reaction.

