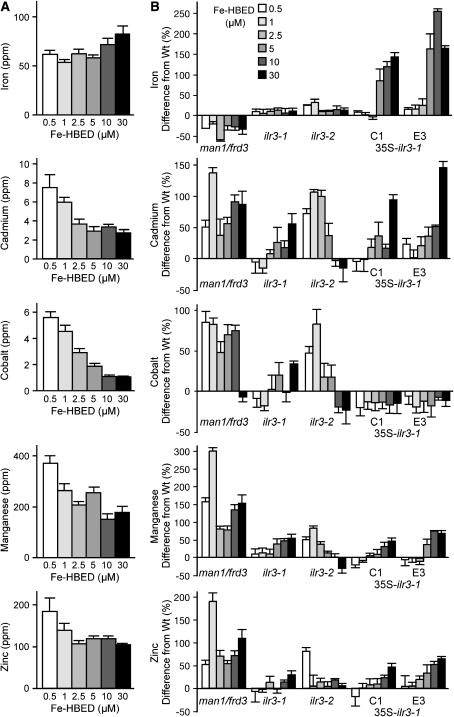
Figure 9.—
Altered ionomic responses to iron in ilr3 mutants. Col-0 (Wt), man1/frd3-3, ilr3-1, ilr3-2, and two independent lines of Wt (35S–ilr3-1) were grown in short-day conditions and watered twice weekly with the indicated concentrations of Fe–HBED. Leaf samples from 5-week-old plants were analyzed for As2+, B+, Ca2+, Cd2+, Co2+, Cu2+, Fe3+, K+, Li+, Mg2+, Mn2+, Mo2+, Na+, Ni2+, Pb2+, PO43−, Se2+, and Zn2+ using ICP–MS. Ion profiles of the lines were compared, and levels of selected ions that responded differently to iron in wild type and the mutants are shown. (A) Bars depict median parts per million (ppm) of the indicated metals in wild-type plants (n = 12); error bars represent half of the interquartile range. (B) Median percentage of change from the wild-type value of the indicated mutants at each iron concentration. Error bars represent half of the combined interquartile range.

