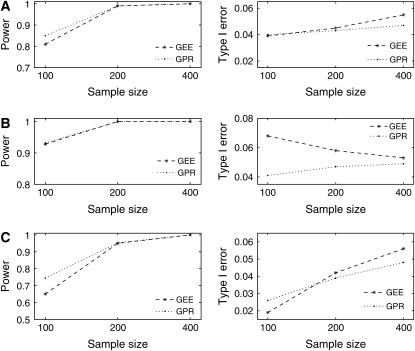
Figure 1.—
The comparison of power and type I error plots between the GEE and GPR approaches from 1000 simulation replicates. Data are simulated using the GPR model under different dispersion patterns of (A) underdispersion, (B) no dispersion, and (C) overdispersion with parameters listed in Table 1 and are analyzed using the GEE and GPR approaches separately.

