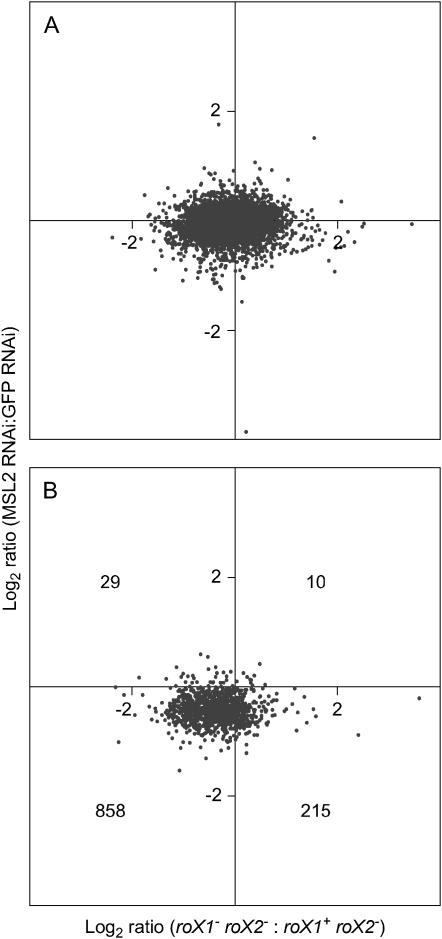
Figure 3.—
X-linked genes display similar changes in roX1− roX2− males and MSL2-depleted S2 cells. (A) Log2 ratio of change in expression for autosomal genes in response to loss of both roX genes (x-axis; this study) plotted against log2 ratio of change in response to MSL2 depletion in S2 cells (y-axis; Hamada et al. 2005). (B) Log2 ratio of change in expression of X-linked genes in response to loss of both roX genes plotted against log2 ratio of change in S2 cells in response to MSL2 depletion. The number of X-linked genes in each quadrant is indicated. Only genes detected on all 12 arrays contributed to this analysis. Raw microarray data from Hamada et al. (2005) have been renormalized using the methodology of this study (see materials and methods).

