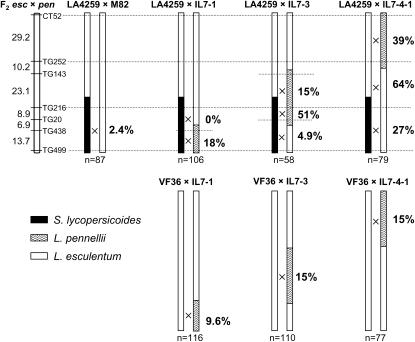
Figure 6.—
Recombination in “bridging” introgression lines containing introgressed segments from S. lycopersicoides and L. pennellii on chromosome 7. Dotted lines indicate the marker loci used to measure recombination within each segment and their positions on the RFLP map (Tanksley et al. 1992). Recombination frequencies are expressed as the percentage of the expected values for the same marker intervals. An  indicates the region to which each recombination value applies. The positions of the L. pennellii segments are from Liu and Zamir (1999). The controls are the lines containing a single introgressed segment, either from S. lycopersicoides (LA4259) or from L. pennellii. The single-segment L. pennellii controls were genotyped with the same markers as the corresponding segments in the double-introgression stocks. Recombination estimates are based on F2 populations (of size n) corresponding to the crosses indicated above the chromosomes. Single-introgression lines were crossed to L. esculentum cv. M82 or VF36 so that all recombination tests were carried out in a constant genetic background, equivalent to F1 VF36 × M82.

