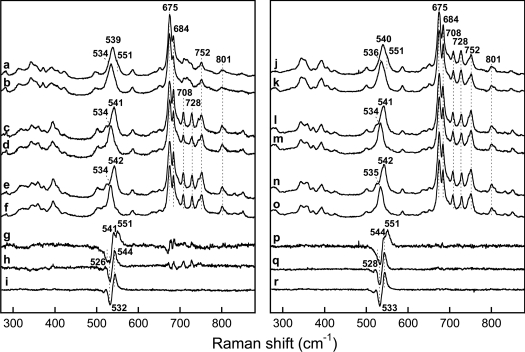
Figure 2. Low-frequency region of the resonance Raman spectra of the FeIII–NO complexes of saNOS (left) and bsNOS (right).
The spectra were obtained with the L-arginine-free and pterin-free proteins with 14N16O (a and j) and 15N16O (b and k). The 14N16O minus 15N16O difference spectra (a minus b and j minus k) are shown in (g) and (p). The spectra of the L-arginine-bound proteins (1 mM) were obtained with 14N16O (c and l) and 15N16O (d and m). The 14N16O minus 15N16O difference spectra (c minus d and l minus m) are shown in (h) and (q). The spectra of the L-arginine- and H4B-bound proteins were obtained with 14N16O (e and n) and 15N16O (f and o). The 14N16O minus 15N16O difference spectra (e minus f and n minus o) are shown in (i) and (r).

