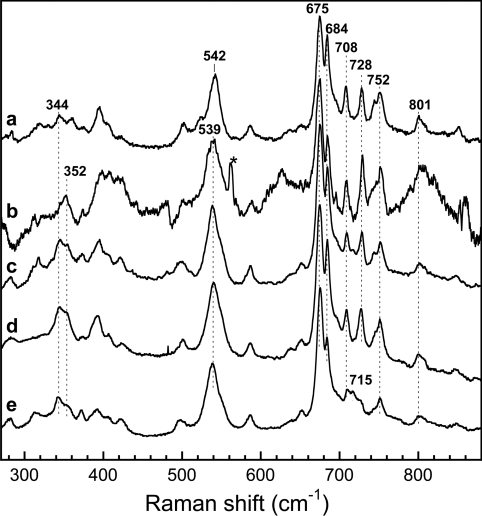
Figure 3. Comparison of haem modes in the low-frequency region of the FeIII–NO complexes of saNOS and bsNOS.
The spectra were obtained in the presence of 1 mM L-arginine (a, which is the same spectrum as Figure 2, line c), 1 mM THF (b), H4B (c) and in the absence of both substrate and H4B for bsNOS (d, which is the same spectrum as Figure 2, line j) and saNOS (e, which is the same spectrum as Figure 2, line a). * represents a laser line.

