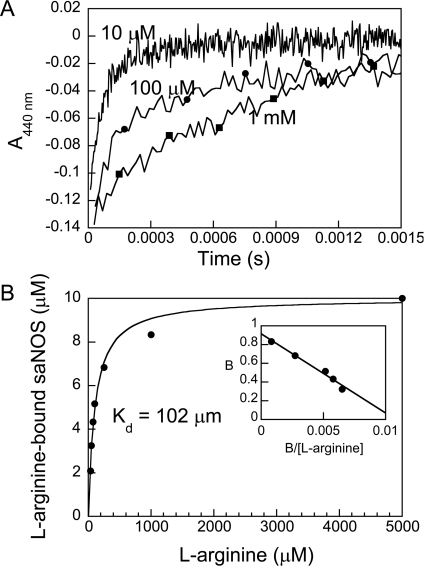
Figure 4. Kinetics of NO rebinding following laser flash photolysis of FeIII–NO saNOS samples containing L-arginine.
(A) The kinetic traces were obtained with FeIII–NO complexes of saNOS equilibrated with 10 μM to 5 mM L-arginine.A total of ten kinetic traces were recorded at each L-arginine concentration and averaged. The traces shown are those recorded at 440 nm with 10 μM (no symbols), 100 μM (●), and 1 mM L-arginine (■). (B) Plot of the concentration of L-arginine-bound saNOS calculated from the amplitude of the slow kinetic phase as a function of L-arginine concentration. Kd (102±8 μM) was calculated using eqn 1. The inset shows the Scatchard plot of these results. (B is the fraction of saNOS bound to L-arginine). The linear fit to the data indicate that the number of binding sites was 0.92 (intercept on the y axis).

