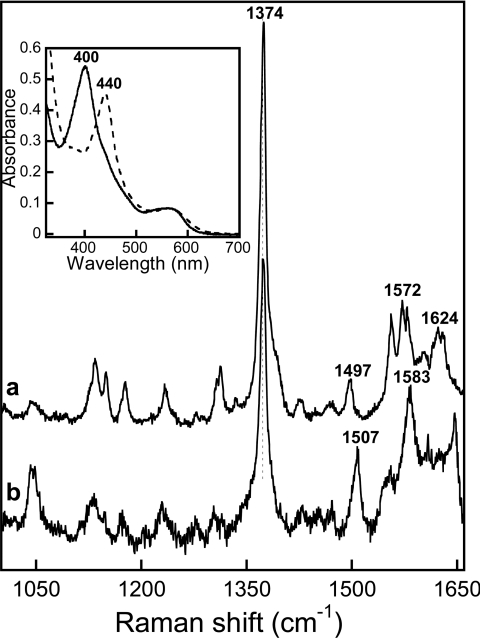
Figure 5. High-frequency region of the resonance Raman spectra of the FeII–NO complexes of saNOS.
The spectra of L-arginine-saturated saNOS (a) and substrate-free and pterin-free samples (b) are shown. The inset shows the optical absorption spectra of saNOS–L-arginine (dashed line) and substrate-free and pterin-free saNOS (solid line).

