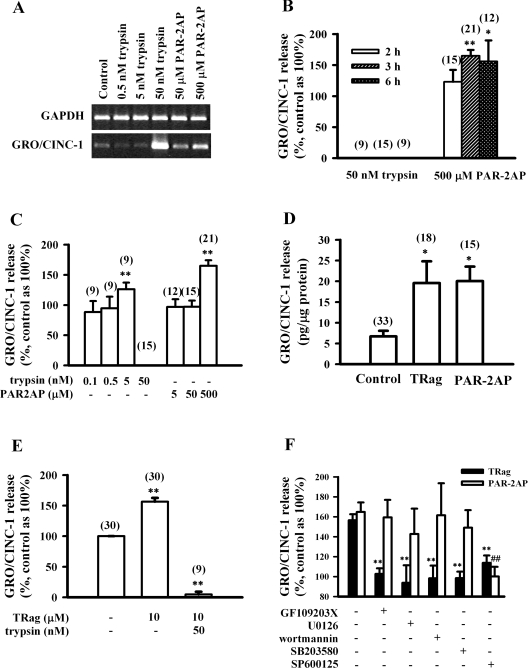
Figure 1. PAR-2 activation results in GRO/CINC-1 up-regulation at both mRNA and protein levels in rat astrocytes.
(A) Representative gel analysis of GRO/CINC-1 mRNA level induced by trypsin (0.5–50 nM) or PAR-2AP (50–500 μM) for 3 h. (B) Time dependence of GRO/CINC-1 release induced by 50 nM trypsin or 500 μM PAR-2AP for 2, 3 or 6 h. (C) Concentration dependence of GRO/CINC-1 release induced by 3 h incubation with trypsin (0.1–50 nM) or PAR-2AP (5–500 μM). (D) The amount of GRO/CINC-1 release induced by 3 h incubation of 10 μM TRag or 500 μM PAR-2AP. (E) Degradation of GRO/CINC-1 by trypsin. Cells were firstly treated with 10 μM TRag for 2 h, then treated with 50 nM trypsin together with TRag for another 1 h. Cells stimulated by 10 μM TRag alone for 3 h served as the positive control. Cells without treatment were taken as basal control (100%). (F) JNK activation contributes to both PAR-1- and PAR-2-induced GRO/CINC-1 release. Serum-starved cells were pre-incubated with PKC inhibitor GF109203X (5 μM), MEK-1/2 inhibitor U0126 (25 μM), PI3K inhibitor wortmannin (5 μM), p38 MAPK inhibitor SB203580 (10 μM) or JNK inhibitor SP600125 (30 μM) for 30 min prior to 3 h stimulation with 10 μM TRag or 500 μM PAR-2AP. Astrocytes without any treatment were taken as baseline (100%). Cells treated only with TRag or PAR-2AP served as positive control for GRO/CINC-1 release. (B–E) Numbers given in parentheses above the respective columns represent the number of samples. Results in (B–F) show the means±S.E.M. for at least three independent experiments. **P<0.01, *P<0.05 as compared with control in (B–E). **P<0.01 as compared with the cells exposed to TRag alone in (F). ##P<0.01 as compared with the cells exposed to PAR-2AP alone in (F).

