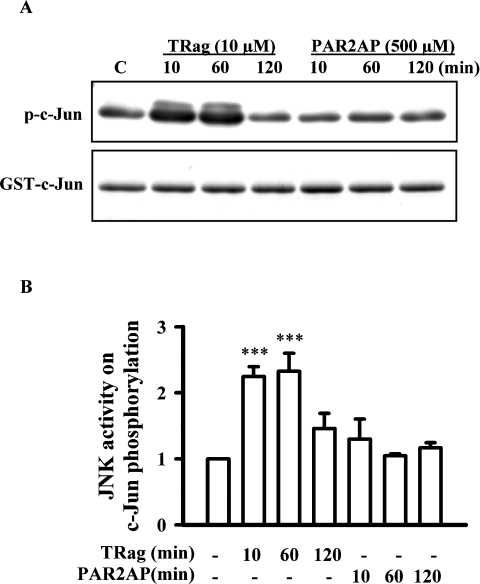
Figure 4. Time course of JNK activity in response to TRag or PAR-2AP treatment in rat astrocytes.
(A) JNK activity in response to 10 μM TRag or 500 μM PAR-2AP treatment for the indicated times was evaluated by non-radioactive kinase assay. The upper panel shows the phosphorylation of c-Jun induced by TRag and PAR-2AP time-dependently; the lower panel demonstrates the equal loading of each sample by Coomassie Blue staining. (B) The amount of c-Jun phosphorylation was quantified and normalized relative to that of control. Results are presented as means±S.E.M. for at least three independent experiments. ***P<0.001 as compared with the control.

