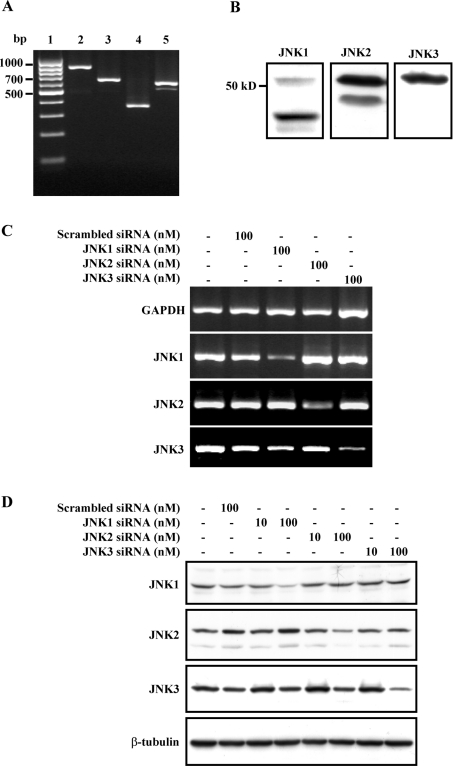
Figure 5. Expression and silencing of JNK1, JNK2 and JNK3 in rat astrocytes.
(A) RT–PCR determination of JNK1, JNK2 and JNK3 expression. Lanes 1–5 represent marker, GAPDH, JNK1, JNK2 and JNK3 respectively. (B) Expression of JNK1, JNK2 and JNK3 in rat astrocytes by Western blot. (C) The mRNA levels of JNK isoforms detected by RT–PCR after transfection with scrambled siRNA (100 nM, lane 2), JNK1 siRNA 1 (100 nM, lane 3), JNK2 siRNA 1 (100 nM, lane 4) or JNK3 siRNA 1 (100 nM, lane 5) for 48 h. Cells without any treatment served as the control (lane 1). Representative gels for GAPDH, JNK1, JNK2 and JNK3 are shown. (D) The protein levels of JNK isoforms detected by Western blot after transfection with scrambled siRNA (100 nM, lane 2), JNK1 siRNA 1 (10–100 nM, lanes 3 and 4), JNK2 siRNA 1 (10–100 nM, lanes 5 and 6) or JNK3 siRNA 1 (10–100 nM, lanes 7 and 8) for 48 h. Cells without any treatment served as control (lane 1). Representative blots for JNK1, JNK2, JNK3 and β-tubulin are shown.

