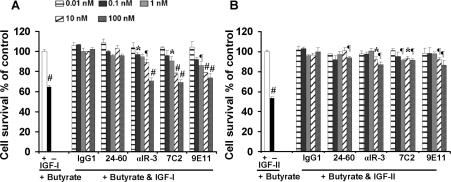
Figure 5. Inhibition of IGF-I action through the IGF-1R by anti-IGF-1R mAbs.
Proliferation of HT-29 colon cancer cells was measured in the presence of 5mM butyrate and 10 nM IGF-I (A) or 50 nM IGF-II (B) with increasing amounts of mAbs 7C2, 9E11, 24-60 and αIR-3 or a control IgG1. Results are expressed as a percentage of proliferation in the presence of ligand alone. Results are means±S.D. of triplicate samples and are representative of three separate experiments. The P values were calculated by comparing the results for the treatment of cells with IGF-I or IGF-II (but not mAb) with other treatments. *0.01<P<0.05; ¶0.001<P<0.01; #P<0.001.

