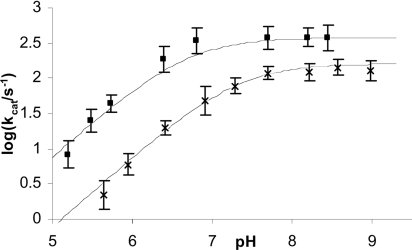
Figure 2. pH-rate profile for CoBcII-catalysed hydrolysis of cefoxitin.
Plot of log kcat against pH for CoBcII-catalysed hydrolysis of cefoxitin in 0.025 M buffer, I=0.25 M, in the presence of 10−4 M cobalt ions (×) and 10−3 M cobalt ions (■); the solid lines are the calculated values using eqn (1) and the parameters in Table 1 (Scheme 4).

