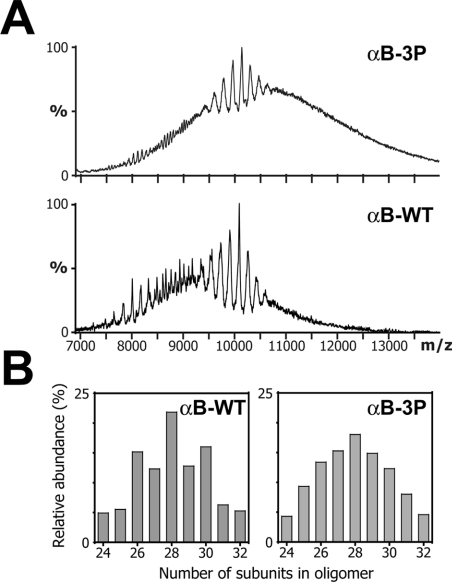
Figure 2. Oligomeric distribution of αB-WT and αB-3P.
(A) Nanospray mass spectra of αB-WT and αB-3P. The peaks at 10080 and 10200 m/z, corres-ponding to species with two charges per subunit for αB-WT and αB-3P respectively, were iso-lated and subjected to collision-induced dissociation. The doubly stripped oligomers were used to calculate the oligomeric distribution of the intact proteins as described previously [24]. (B) His-tograms quantifying the relative abundance of the various oligomeric species for αB-WT and αB-3P.

