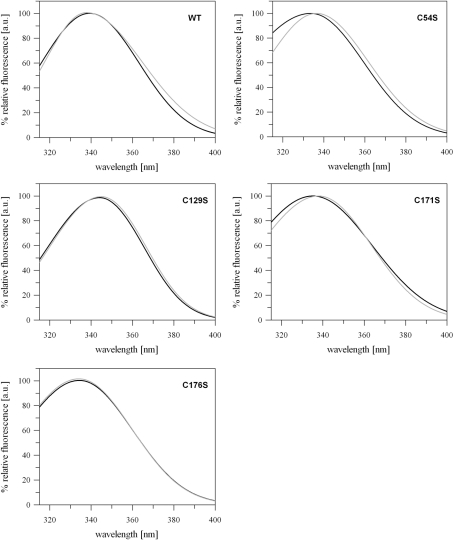
Figure 2. Intrinsic tryptophan fluorescence emission spectra of CYP20-3WT and the cysteine→serine variants as a function of thiol redox state.
Tryptophan fluorescence of the proteins was measured under reducing (black line) and oxidizing (grey line) conditions after excitation at λex=290 nm (n≥9 for each protein). Data were fitted with the software program FindGraph. The wavelengths of the emission maxima (λem-max) are given in Table 1.

