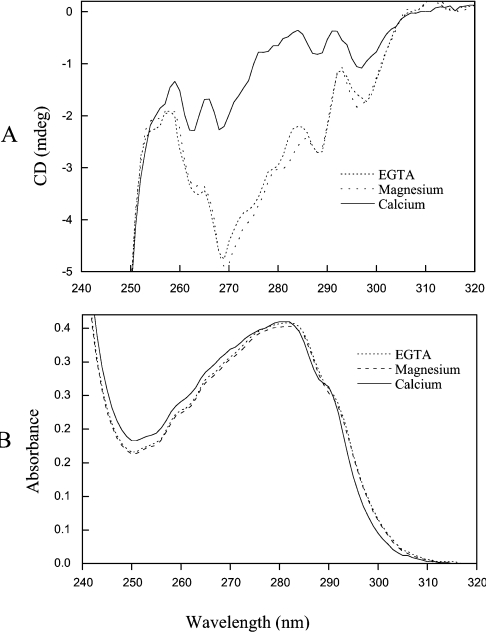
Figure 1. Near-UV CD (A) and absorbance spectroscopy (B).
(A) Near-UV CD spectroscopy. A near UV CD spectrum was first obtained for the apo-protein (37 μM apo-secretagogin in 1 mM DTT, 0.5 mM EGTA and 2 mM Tris/HCl, pH 7.5) (dotted line). MgCl2 was added to a concentration of 5 mM, and a spectrum for the Mg2+ form was recorded (broken line). Finally CaCl2 was added to a concentration of 1 mM, and a spectrum for the Ca2+ form was recorded (continuous line). (B) Near-UV absorbance spectroscopy. The UV spectrum at room temperature was recorded for a solution of 37 μM secretagogin in 1 mM DTT, 0.5 mM EGTA and 2 mM Tris/HCl (pH 7.5) (apo-secretagogin; dotted line). Then, 5 mM MgCl2 was added to the same solution (broken line). Finally, 1 mM CaCl2 was added to the same solution (continuous line).

