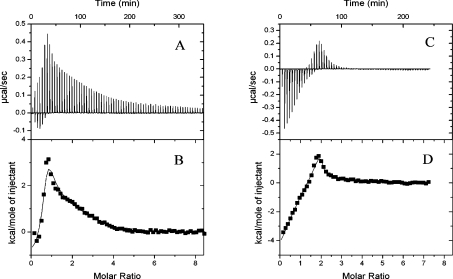
Figure 4. ITC analysis of the Ca2+ binding to secretagogin.
Calorimetric titration of 40×4 μl aliquots of 1 mM CaCl2 into 25 μM secretagogin in 2 mM Hepes/NaOH (pH 7.5) with raw data minus baseline in (A) and fitted data in (B). The same experiment performed in 2 mM Hepes/NaOH (pH 7.5) with 0.15 M NaCl is shown with raw data minus baseline in (C) and fitted data in (D).

