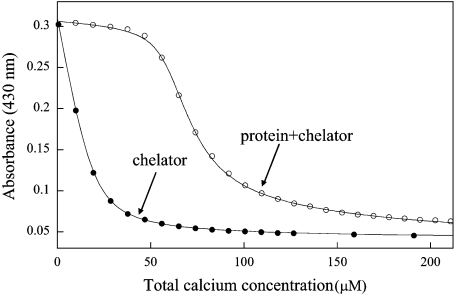
Figure 5. Ca2+ titration of secretagogin.
Titration of 22 μM 5N-BAPTA with Ca2+ in the presence of 57 μM secretagogin in 2 mM Tris/HCl (pH 7.5). The experimental data are shown as symbols and the curves of optimal fit to the data points as continuous lines. ○, Titration of a mix of protein and chelator. ●, titration of only chelator.

