Figure 1.
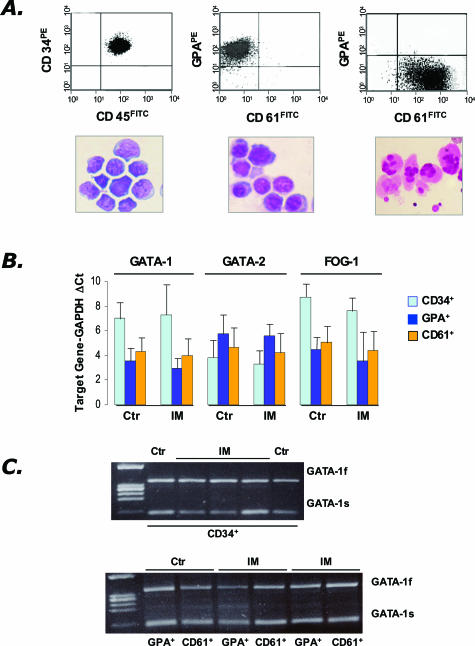
Analysis of GATA-1 mRNA in CD34+ cells purified from the peripheral blood of IM patients or the BM of controls, and in their erythroid (GPA+) or megakaryocyte (CD61+) progeny obtained in vitro. A: Purity of the isolated cell fractions (CD34+, GPA+, CD61+, from the left) was re-evaluated by fluorescence-activated cell sorting analysis (top), whereas morphological appearance was assessed on May-Grümwald/Giemsa-stained cytosmears (bottom). B: Quantification of GATA-1, GATA-2, and FOG-1 mRNA levels by real-time RT-PCR analysis. A total of 8 controls (for all different cell populations), and 12, 11, and 10 IM patients, respectively, for CD34+, GPA+, and CD61+ cells were analyzed. Results are expressed as mean (±SD; each sample assayed in triplicate) ΔCt for each target gene after normalization for the amplification level of the housekeeping GAPDH gene; lower ΔCt values indicate higher target gene expression levels. C: RT-PCR amplification of the full-length (GATA-1f) and the shorter (GATA-1s) GATA-1 transcript starting from mRNA of CD34+, GPA+, and CD61+ cells. The results are representative of those obtained with cells purified from a total of four controls and seven IM patients. Amplicons were analyzed during the exponential phase of PCR (cycles = 31). The lane on the left contains molecular weight markers (marker IX).

