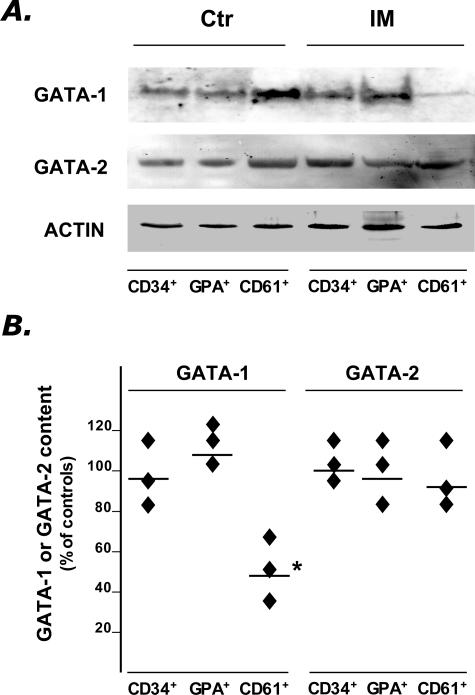
Figure 2.
Western blot analysis of GATA-1 and GATA-2 protein in purified CD34+, GPA+, and CD61+ cells obtained from IM patients and controls. A: Due to the low amount of protein recovered, pools of three IM patients or four controls were prepared by mixing equal numbers of cells purified from each patient. A representative blot from one normal and one IM pool is shown in A, while the percentage changes of GATA-1 and GATA-2 protein content in the three IM pools (as compared to the two control pools), after normalization for the actin content, is shown in B. Horizontal lines indicate the mean values. *P = 0.02. Films in A were exposed for different times (5 minutes for GATA-1 and GATA-2, 45 seconds for actin).

