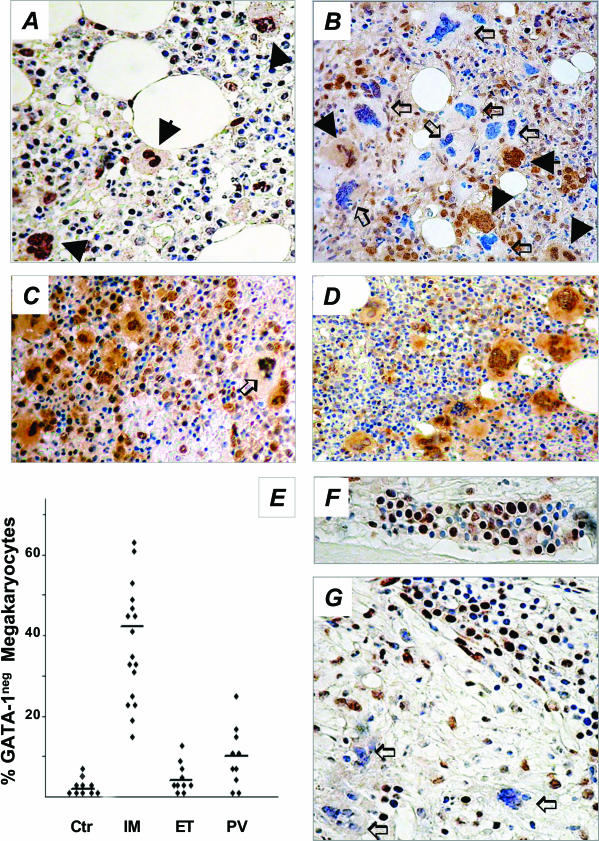
Figure 3.
Immunohistochemistry analysis of GATA-1 in BM biopsies from IM patients (B, G) or controls (A, F). In A, all morphologically recognizable megakaryocytes (filled arrows) are strongly stained in the nucleus, with some cytoplasmic staining. On the other hand, the heterogeneity typically observed in IM samples, with a combination of megakaryocytes normally stained (filled arrows) or showing no to very faint nucleus/cytoplasmic staining (open arrows) (GATA-1neg megakaryocytes) can be appreciated in B. The staining pattern in PV or ET patients is shown in C and D, respectively. The percentage of GATA-1neg megakaryocytes in controls (n = 10) and in patients with either IM (n = 17), ET, or PV (n = 10 for both) is shown in E. Early erythroid cells in a typical erythroid island of a normal patient (F) are heavily stained, whereas more mature erythroblasts show weaker staining; the same pattern can be appreciated in the section from an IM patient (G), in which GATA-1pos erythroblasts appear surrounded by GATA-1neg megakaryocytes (open arrows). Original magnifications, ×200.

