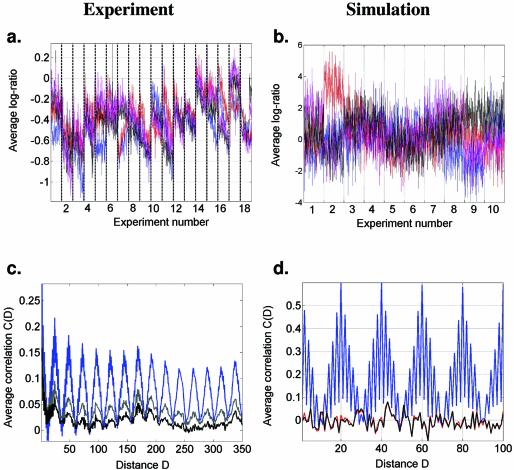
Figure 3.
Print tip-related bias across all experiments and the corresponding simulation. (a) Average log-ratios of expression levels of the features printed by each of the four tips within each 96-well plate used in each experiment (IAD). Blue, red, black and magenta correspond to print tips 1–4, respectively (the numbers define the spatial position within the print head and not the actual print tip). The abrupt changes of the average log-ratios between experiments are likely to correspond to cleaning and interchanging the print heads. Notice how the bias gradually changes within each experiment, until the tips are cleaned or changed. (b) The corresponding simulation: four groups of 10 × 10 uncorrelated Gaussian random numbers were generated in 18 in silico experiments. Additionally, four independent random numbers were added to each of the four groups within each experiment. The log-ratios of simulated expression levels of all spots within each ‘experiment’ are shown. To correct for the tip-related bias, the mean log-ratio for tips 1–4 within each experiment is subtracted from the corresponding group of spots. (c) The result of the correction: average cross-correlation calculated as in Figure 1, but using all genes instead of those residing on the same chromosome. The blue, gray and black lines correspond to the original data, the first degree and the second degree correction, respectively. In the second degree correction, a linear trend of the log-ratios is subtracted within each experiment instead of simply subtracting the mean log-ratio. Notice that the 2 gene and 24 gene periodicities nearly disappear, but a 176 gene periodicity is revealed. (d) Correction of the computationally generated data. The red, blue and black lines correspond to the original, bias-affected and corrected data, respectively. Notice that the correction algorithm almost completely recovers the original in silico data after the correction.

