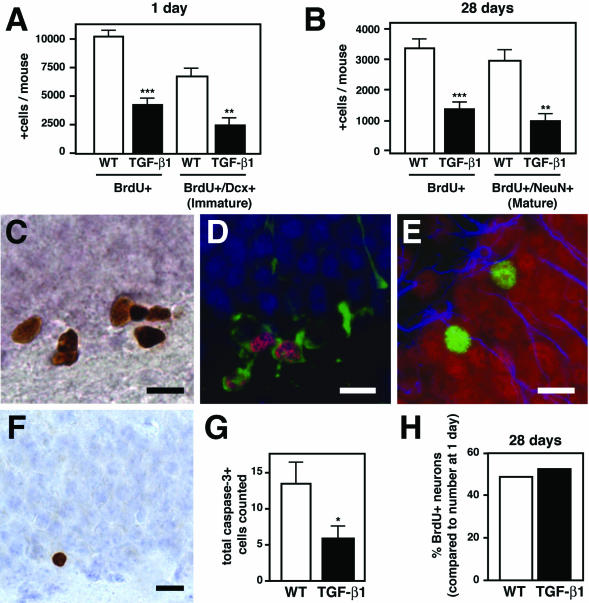
Figure 2.
TGF-β1 mice have 60% fewer BrdU-positive cells and BrdU-positive neurons in the hippocampus 1 and 28 days after BrdU administration. TGF-β1 transgenic (n = 5 mice per time point) and nontransgenic littermate controls (n = 5 to 8 mice) were injected at 8 weeks of age with BrdU to label dividing cells and analyzed 1 day or 28 days later for the presence of BrdU-positive cells and BrdU-positive neurons. Doublecortin was used to label immature neurons, and NeuN to label mature neurons. A: Quantification of the number of BrdU-positive cells and the number of BrdU-positive cells co-labeling for doublecortin (BrdU+/Dcx+) 1 day after BrdU administration. Bars are mean ± SEM. B: Quantification of total BrdU-positive cells and BrdU-positive mature neurons (BrdU+/NeuN+ cells) 28 days after BrdU. Bars are mean ± SEM. C: Example of BrdU-positive cells in the subgranular zone of the dentate gyrus, counterstained with hematoxylin. D: Confocal image of brain section containing BrdU+/Dcx+ cells. BrdU, magenta; Dcx, green; and NeuN, blue. E: Confocal image of brain section containing BrdU+/NeuN+ cells. BrdU, green; NeuN, red; and GFAP, blue. F: Example of a cell in the granule cell layer immunostained with caspase-3, counterstained with cresyl violet. G: Quantification of the number of caspase-3-positive cells counted in dentate gyrus subgranular zone and granule cell layer in 13-week-old TGF-β1 mice and their wild-type littermates, n = 5 mice per genotype. H: Relative percentage of surviving neurons calculated as the fraction of new mature neurons (BrdU+/NeuN+) present at 28 days after BrdU compared with the number of new immature neurons (BrdU+/Dcx+) present 1 day after BrdU. Bars represent the percent difference between the means in A and B. *P ≤ 0.05, **P ≤ 0.005, ***P ≤ 0.0005; Student’s t-test. Scale bars = 10 μm.

