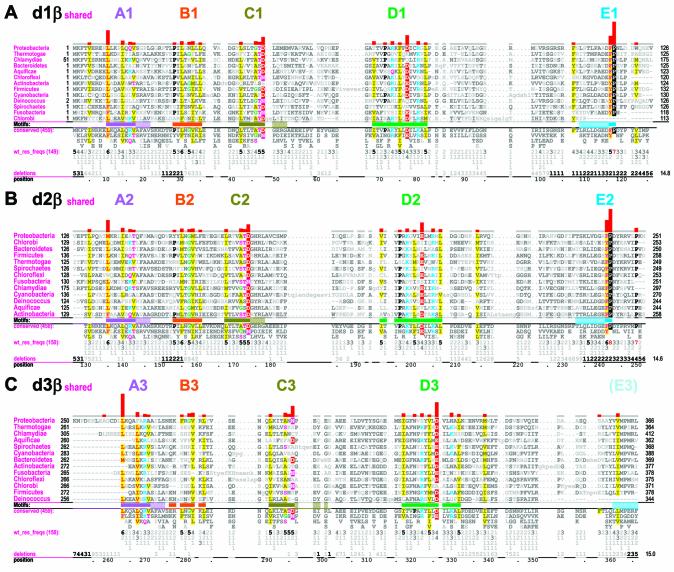
Figure 2.
β Domain-shared constraints. CH alignments for each of the three β clamp domains are shown (see Materials and Methods). The displayed sequences in each alignment represent β clamps from major prokaryotic taxa, which are indicated in the leftmost column. The first sequence (proteobacteria) is the E.coli β clamp, which serves as the query in this and the other CHAIN analyses described here. The bars directly below the aligned sequences indicate the motif regions discussed in the text and are colored to match the main-chain traces for these regions in Figures 1, 6 and 7; solid bars indicate the main motifs while adjacent hashed bars indicate associated satellite regions. The full foreground sequence alignment is not shown directly, but rather is merely represented by the conserved residue patterns below the alignment. The corresponding weighted residue frequencies (‘wt_res_freqs’) are given in integer tenths below conserved residues. For example, a ‘5’ in integer tenths indicates that the corresponding residue directly above it occurs in 50–60% of the (weighted) sequences. Deletion frequencies are similarly given in integer tenths (black; range 10–100%) or hundredths (gray; range 1–9%) as indicated. Histograms above the alignments display the relative strengths of the inferred selective constraints acting at each position (using a quasi-logarithmic scale); aligned residues corresponding to the most constrained positions are highlighted for emphasis. (A) β Domain 1-shared constraints. (B) β Domain 2-shared constraints. (C) β Domain 3-shared constraints.

