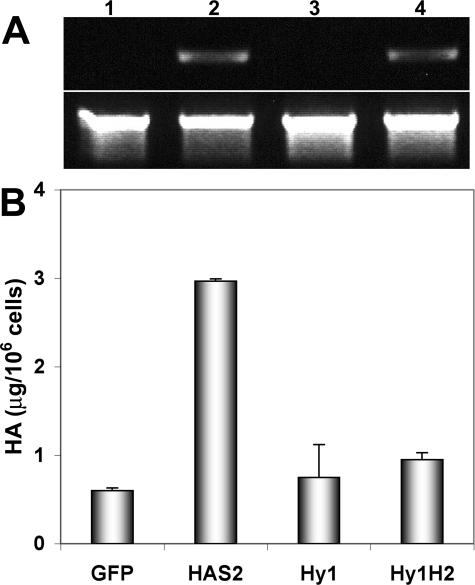
Figure 3.
HA production is enhanced in HAS transfectants. A: Expression of HAS2 mRNA in 22Rv1 cells stably selected for GFP control (lane 1), HAS2 (lane 2), Hyal1 (lane 3), or Hyal1 plus HAS2 (lane 4) was assayed semiquantitatively by RT-PCR (upper panel) with glyceraldehyde-3-phosphate dehydrogenase amplified as a normalization control (lower panel). B: HA content of conditioned media was quantified by competitive binding as described in Materials and Methods and normalized to cell count. The mean value ± SE is plotted for each cell line assayed in triplicate serial dilutions.

