Figure 6.
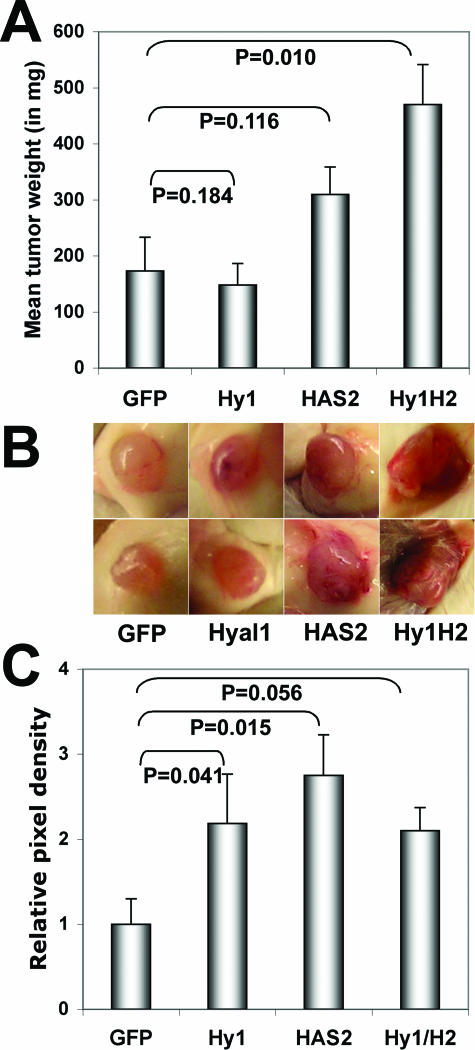
Subcutaneous tumor growth and vascularity are enhanced by HAS2 and Hyal1/HAS2 overexpression. Stably transfected 22Rv1 cells were trypsin-released and resuspended in serum-free RPMI. Male NOD/SCID mice were injected subcutaneously in each flank with 1 × 10⁶ tumor cells. At 4 weeks after injection, tumors were excised, weighed, and preserved for tissue sectioning. A: Mean tumor wet weight ± SE is plotted for each transfected cell line. Statistical significance determined by Student’s two-tailed t-test is indicated on the graph for each cell line relative to the control (GFP). B: Tumors generated by each cell line were photographed in situ. Duplicate representative tumors from each group illustrate macroscopic differences in surface vascularity that correlate with HAS2 overexpression. C: Triplicate cryosections from three tumors per cell line were stained with anti-CD31-phycoerythrin to visualize vascular endothelial cells. Five random digital images per section were captured on a fluorescence microscope and processed as described in Materials and Methods. Mean relative pixel density ± SE for all images within a group is plotted as a measure of tumor vasculature with respect to identically processed tumors from the parental 22Rv1 cell line. Statistical significance, determined by t-test, is indicated on the graph for each cell line relative to the control (GFP). Additional statistics are discussed in the text.

