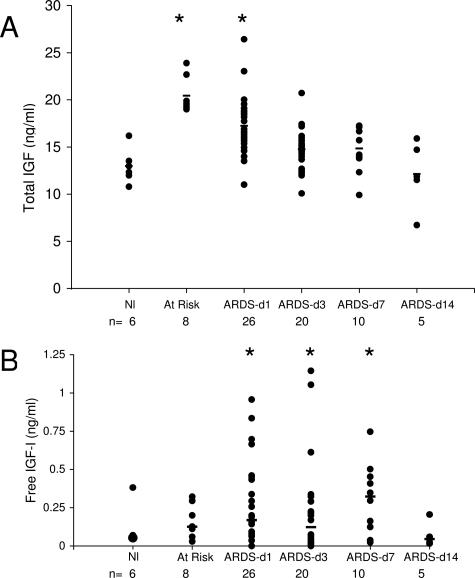
Figure 5.
Total IGF (A) and free IGF (B) protein concentrations (black circles) in BAL from normal volunteers, patients at-risk for ARDS, and patients with established ARDS studied at sequential times. Total and free IGF was quantified by ELISA kit (Diagnostic Standards Laboratory Systems) per the manufacturer’s direction. The concentration of IGF in the samples was determined by interpolation from the standard curve generated with recombinant IGF. All samples were run in duplicate and repeated at least twice. Median (black bars) values are indicated. *, Time points significantly different (P < 0.05) from controls.

