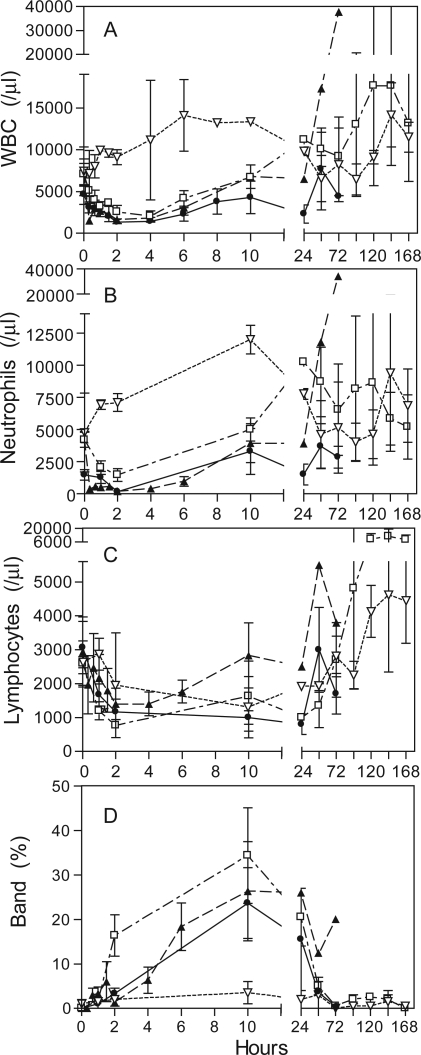
Figure 7-6932.
Cellular responses. A–C: The changes in WBC counts (A) reflect ongoing neutropenia (B) and lymphocytopenia (C). D: The increase in bands is a typical granulopoietic response to septic challenge. There was no clear dose dependence, but the magnitude of the changes reflected the severity of the challenge. Mean ± SEM. Challenge dose in CFU/kg: 105 to 106 (▿, n = 2); 107 (□, n = 3); 108 (•, n = 3); and 109 (▴, n = 3).

