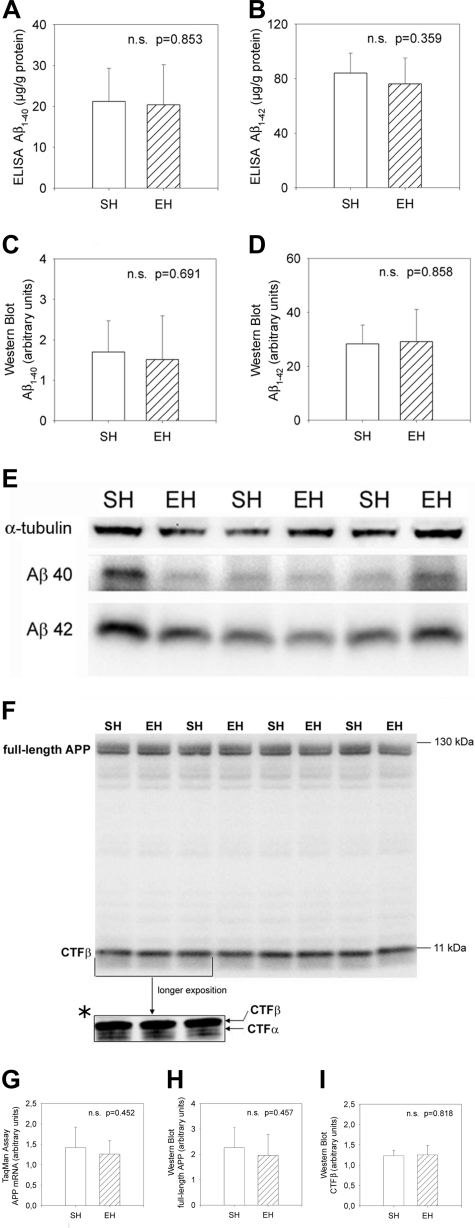
Figure 2-6942.
APP expression and processing. A–D: Steady state levels of soluble Aβ1-40 and Aβ1-42 as measured by ELISA and Western blot. E: Representative Western blot with antibody specific for Aβ (6E10). There are slight variations in levels of detergent-soluble Aβ1-40 and Aβ1-42, but these are fully consistent with the variations observed with a protein loading control, α-tubulin. F: Representative Western blot data showing no differences in full-length APP and in proteolytic fragments of APP (CTFβ). A faint CTFα fragment was only detectable after a longer exposition duration (F*). G–I: Steady state levels of APP mRNA and protein as well as CTFβ stub. No differences were seen in EH versus SH mice. Data are given as means ± SD; statistics, t-test.

