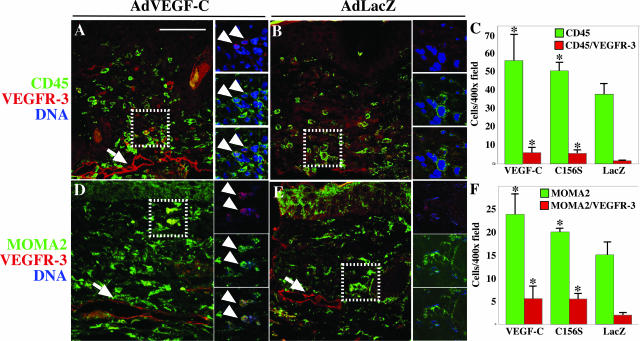
Figure 4.
VEGF-C recruits hematopoietic cells and monocytes/macrophages to the wound margin. A and B: Immunofluorescent double staining of wound sections with antibodies to CD45 (green) and VEGFR-3 (red). D and E: Monocytes/macrophages stained with antibodies to MOMA2 (green), whereas VEGFR-3-positive cells are shown in red. Small panels on the right side of the large images are 0.35-μm confocal optical sections of the area highlighted with a dashed line in the large panel. Co-localization of the signal is indicated with arrowheads. C and F: Quantification of CD45 and CD45/VEGFR-3 (C) or MOMA2- and MOMA2/VEGFR-3-positive (F) cells from wound sections treated with the indicated viruses. P values less than 0.05 (comparison to the AdLacZ control) are marked by an asterisk. Bars represent mean values ± 1 SD (n ≥ 4). Scale bar = 100 μm.

