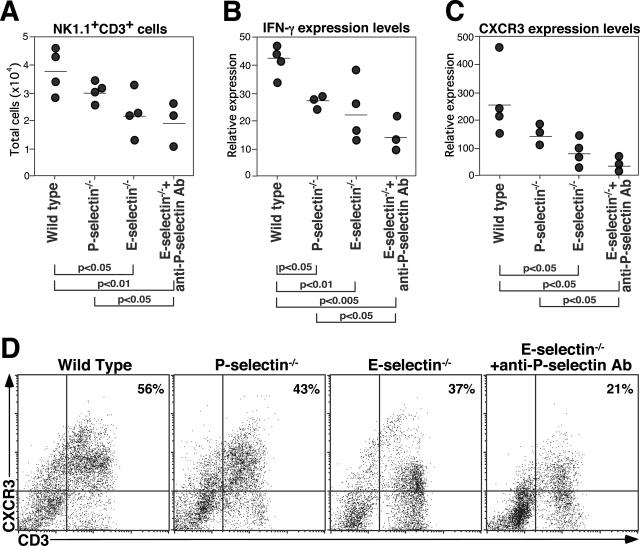
Figure 6.
The reduced NK1.1+CD3+ cell numbers, decreased IFN-γ and CXCR3 expression levels in E-selectin−/− mice and E-selectin−/− mice treated with anti-P-selectin mAb. BAL fluid was analyzed by flow cytometry 4 days after bleomycin administration. Total number of NK1.1+CD3+ cells (A), intracellular IFN-γ expression level of CD3+ cells (B), CXCR3 expression levels of CD3+ cells (C), and representative dot plots of CXCR3+CD3+ cell frequency (D). Percentages of CXCR3+CD3+ cells are shown in the upper right quadrants. These data are representative of three independent experiments.

