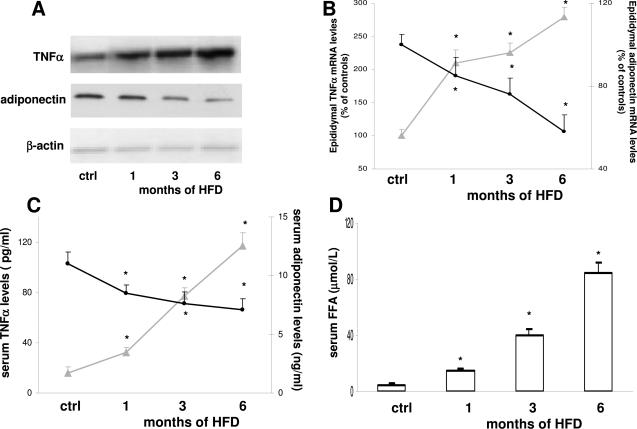
Figure 2.
Effect of HFD on TNF-α and adiponectin mRNA levels (A and B), levels of TNF-α and adiponectin in serum blood (C), and levels of FFA in serum blood (D). No differences were observed between controls at the different time points, which were thus considered as a single control group. A representative agarose gel of RT-PCR for TNF-α and adiponectin mRNA is shown in A. Gray lines, TNF-α; black lines, adiponectin; white bars, FFA. Data are presented as mean ± SD. *P < 0.05 versus controls.

